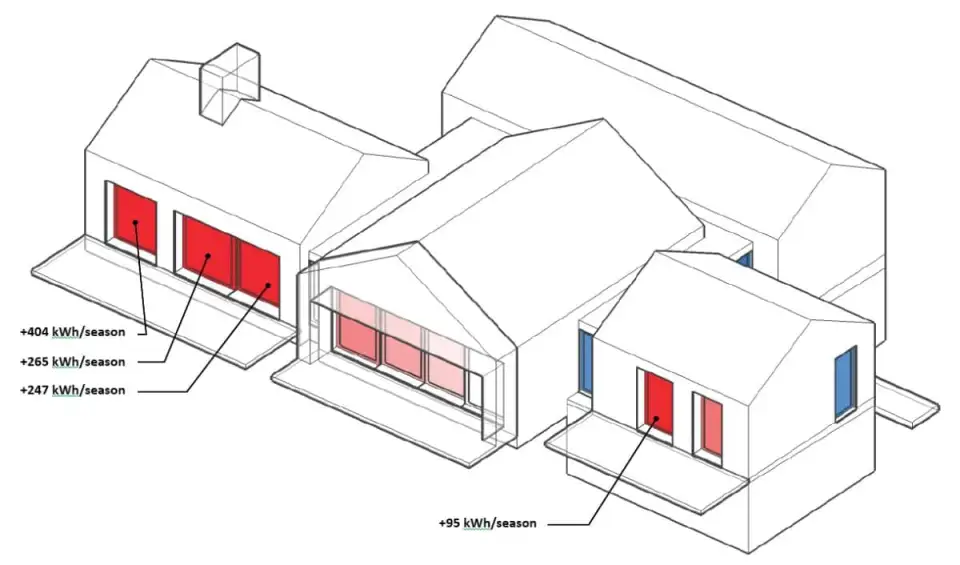
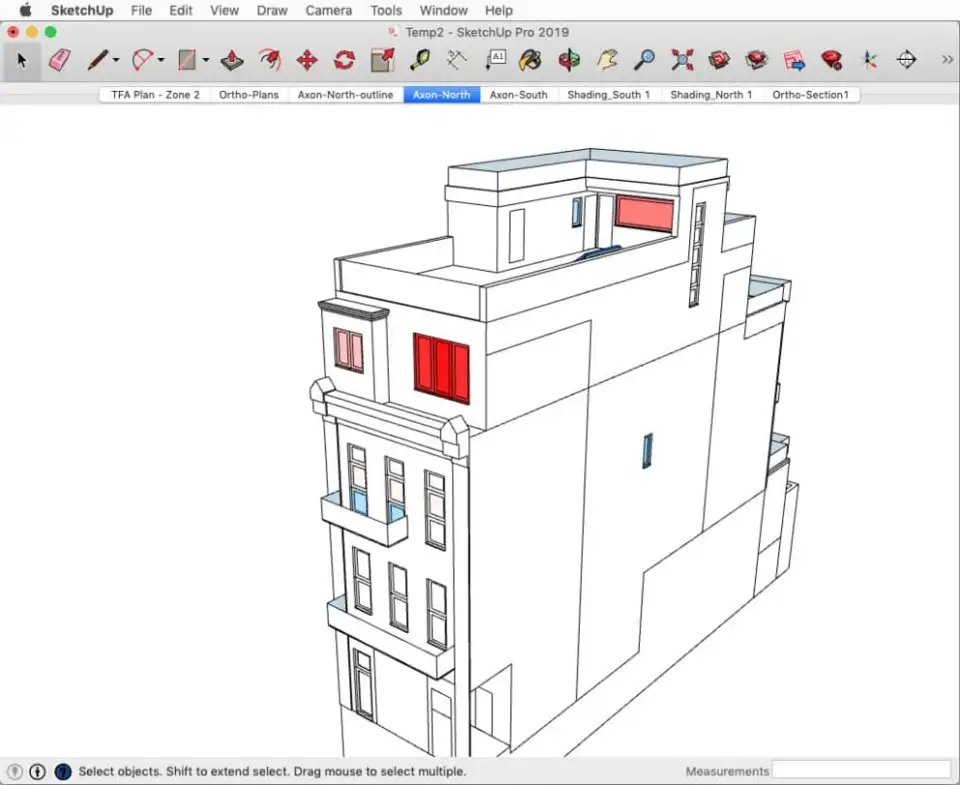
In order to evaluate the performance of windows in a building energy model, it is often helpful to use simple graphical visualizations in order to make model data more ‘meaningful’ and comprehensible to the designer team. Through visualization techniques such as ‘heat maps,’ building performance data can be easy viewed and understood by members of the design team much quicker than if trying to read the raw data. These types of visuals are standard in most client reports we produce and also very useful as ‘error checking’ during the model build.
Below I’ll demonstrate a simple workflow for using the PHPP (Passive House Planning Package) along with the DesignPH Sketchup Plugin to create a simple in-model visualization of building performance data. This feature is not standard to DesignPH and so we have created a small extension which can be added to Sketchup in order to accomplish this. If you’d like to use this extension you can find a download link at the bottom of the page here. Feel free to give it a try and let us know what you think and if it works for you.
Note: the plugin shown here is NOT part of, or associated in any way with the DesignPH tool. It simple adds to a couple new functions to the Sketchup model for those who are already using DesignPH to create PHPP models.
Window Net Energy Balance in the PHPP
PHPP, being an excel based modeling tool, can yield any number of useful evaluations or analyses of a building’s performance data. One area that we look at carefully when reviewing any building is the window net energy balance. By calculating thermal losses and gains, each window can yield an overall energy balance — either gaining or losing energy over the course of the year. Whether you want net gain or loss will depend on your building’s use, climate and size — but being able to identify the critical performance drivers is useful no matter what your goal is.
In PHPP, by default this data is not shown for each window. While there is a bit of data calculated for each window for the winter period, for most North American climates we are equally interested in both the winter and summer periods. In addition, note that the ‘out of the box’ energy balance calculations in the ‘Window’ worksheet are approximations and should usually be supplemented with more detailed calculations.
To that end, we will modify the base PHPP file with these supplemental calculations. Again, being excel, the PHPP is open to any number of add-ons / additional calculations which is very useful. Generally, in the ‘Windows’ worksheet, off to the right hand side we will add calculations for overall window heat loss and solar gain for both winter and summer seasons. The input data needed for these detailed calculations is all in the PHPP and simply needs to be collected together here to allow for the calculation.
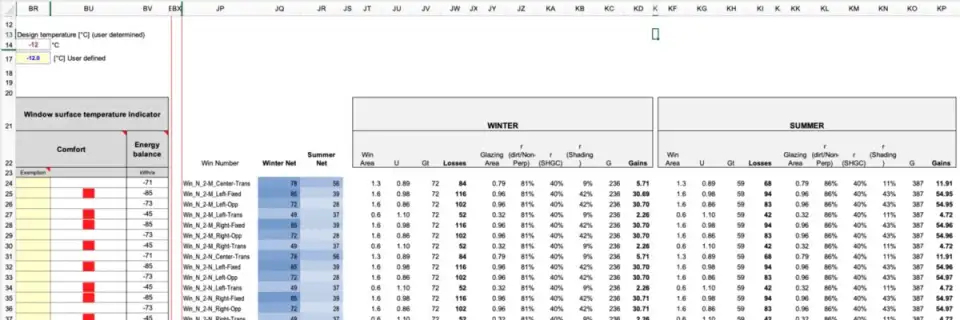
Of course here you can use Excel’s built-in ‘Conditional Formatting’ to apply simple heat-map gradient coloring to the net energy values (see columns JQ and JR above). This is useful for a quick error check review, though for presentation purposes still not very useful. This data, though, can serve as the basis for our Sketchup visualizations. If we can pull this data from excel into a simplified .CSV file (using simple copy/paste, or of course you could build a more ‘automatic’ exporter to pull the data and format it if you were going to be doing this over and over many times during a project) we can then bring it into our Sketchup scene for use by later tools.
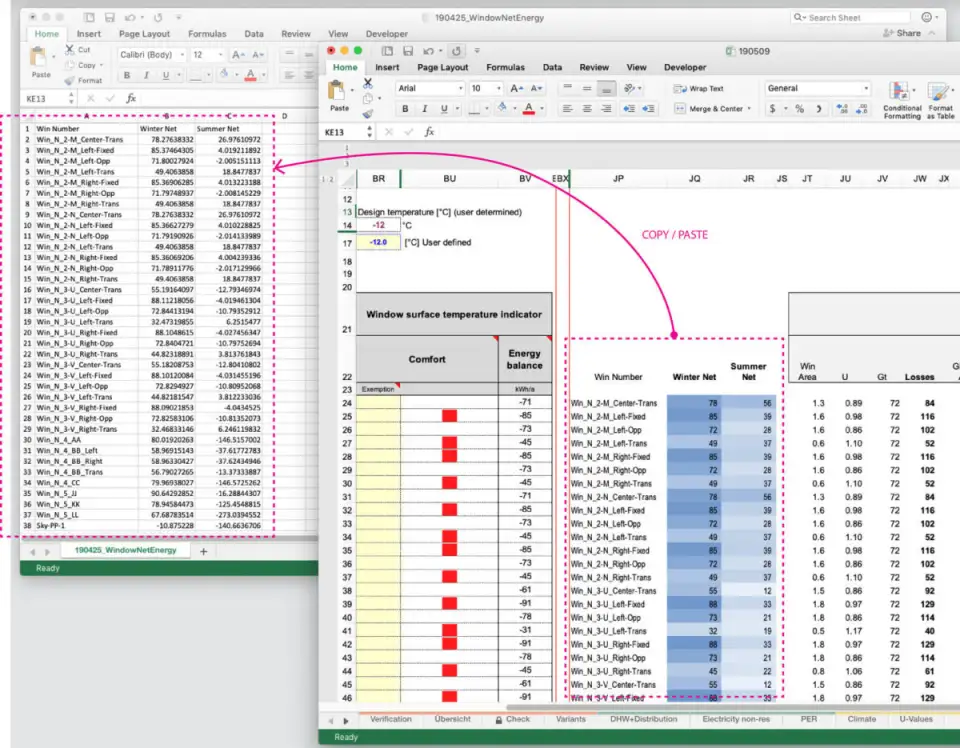
Note that in the above excel PHPP model, we keep the window names along with the window net-energy balance data. Assuming our DesignPH window’s are named the same — we’ll use that identifier to apply the data here back to the Sketchup model.
Sketchup Plugin Workflow
The Sketchup workflow actually has two steps. First we’ll import this data from the CSV file, then we’ll use that data to actually color the scene.
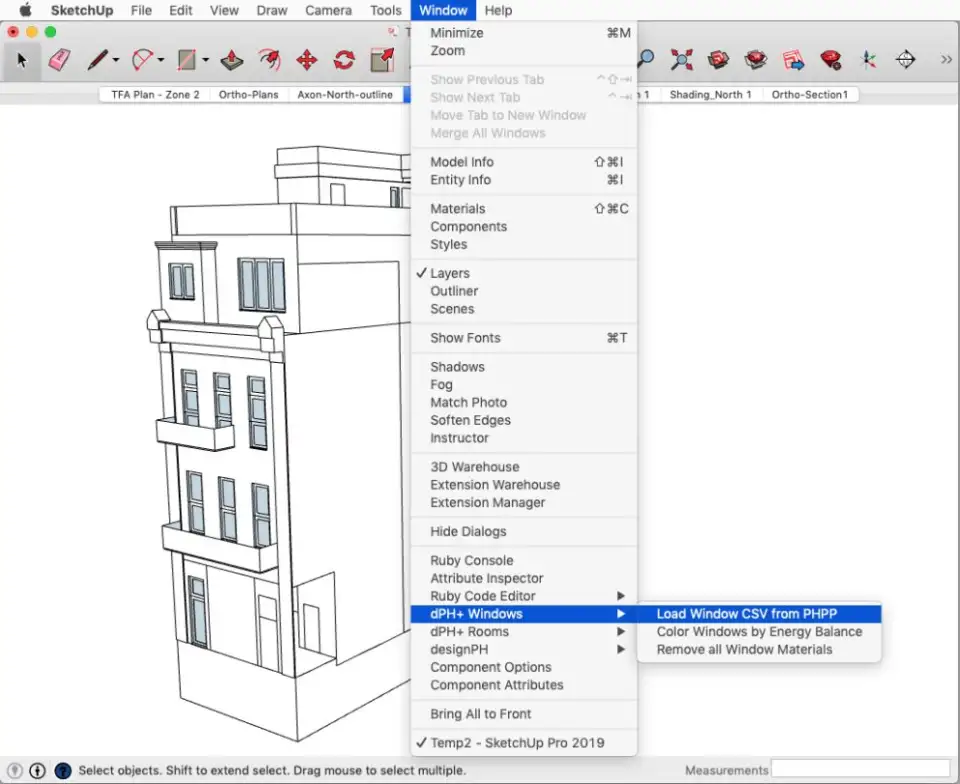
If the plugin is installed correctly, you should now have a new item in Sketchup’s ‘Window’ menu called ‘dPH+ Windows’ — within that new menu you’ll find an ‘import’ tool called ‘Load Window CSV from PHPP’ — if you select this you’ll be prompted to locate the .CSV file we prepared above using your system’s normal browser file dialog window.
It’ll ask you how you’ve set up the data and which column corresponds to the summer data and which the winter data. If you’ve set up your data as I have above, the winter data is in column #1, and the summer data in column #2 (column #0 should be the window names)
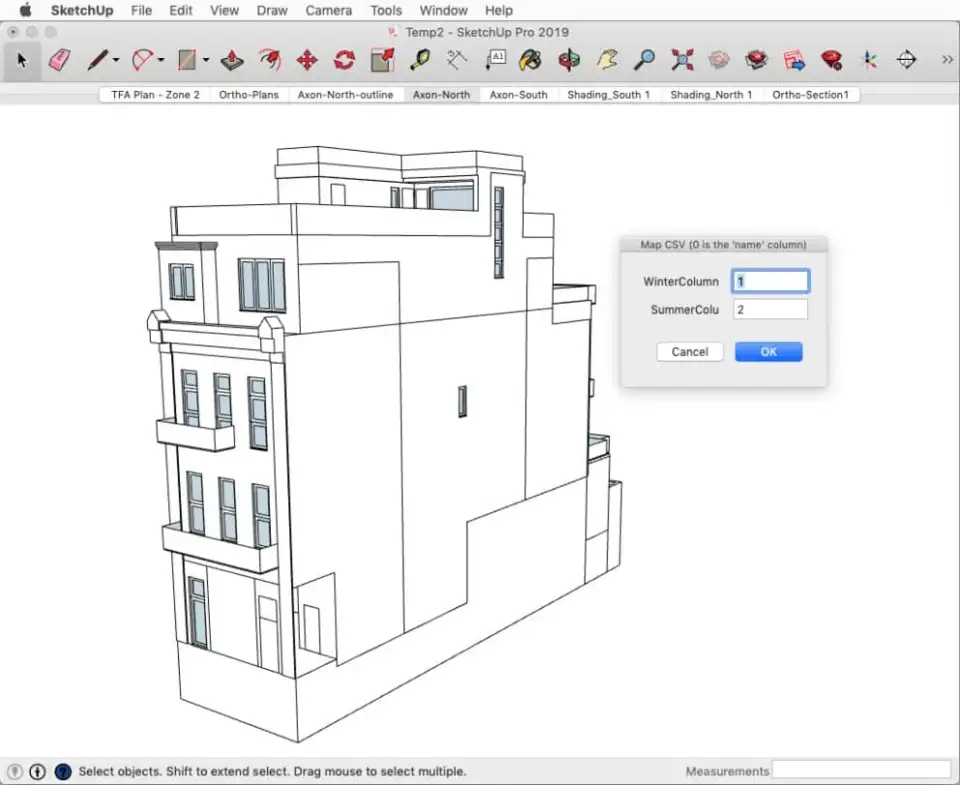
This now takes the data and applies it to the model. It’ll scrub through all the DesignPH objects, find the windows and using the window’s name, it’ll match to the imported .CSV data and add that kWh result from PHPP to the component’s definition in the Sketchup scene. If you open up the ‘Component Attributes’ in Sketchup and navigate to any DesignPH window, you’ll see two new bits of data have been added:
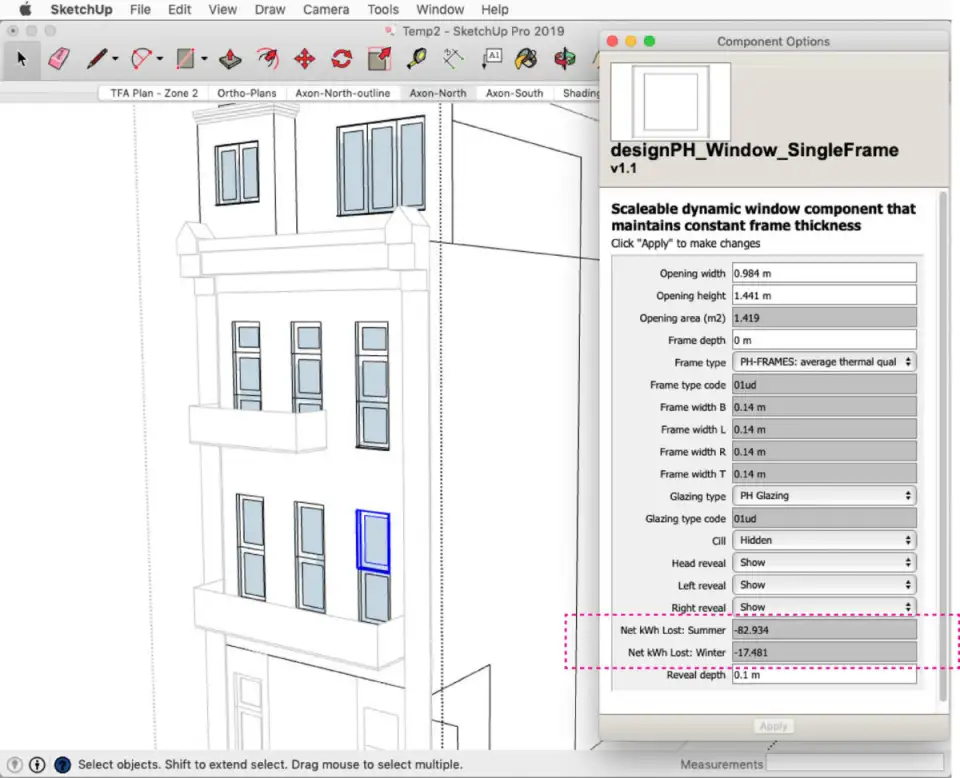
The data here is a net energy ‘loss’ — meaning that a negative loss = a gain. So in the above example, the window has a net gain of 82.9 kWh in summer, and a net gain of 17.4 kWh in winter, according to PHPP.
This data is now embedded in the Sketchup model. You don’t have to load the CSV every-time you want to run a visualization in the scene now — but of course if the calculated data in the PHPP changes you’ll need to reload that data in order to see the change to the visuals.
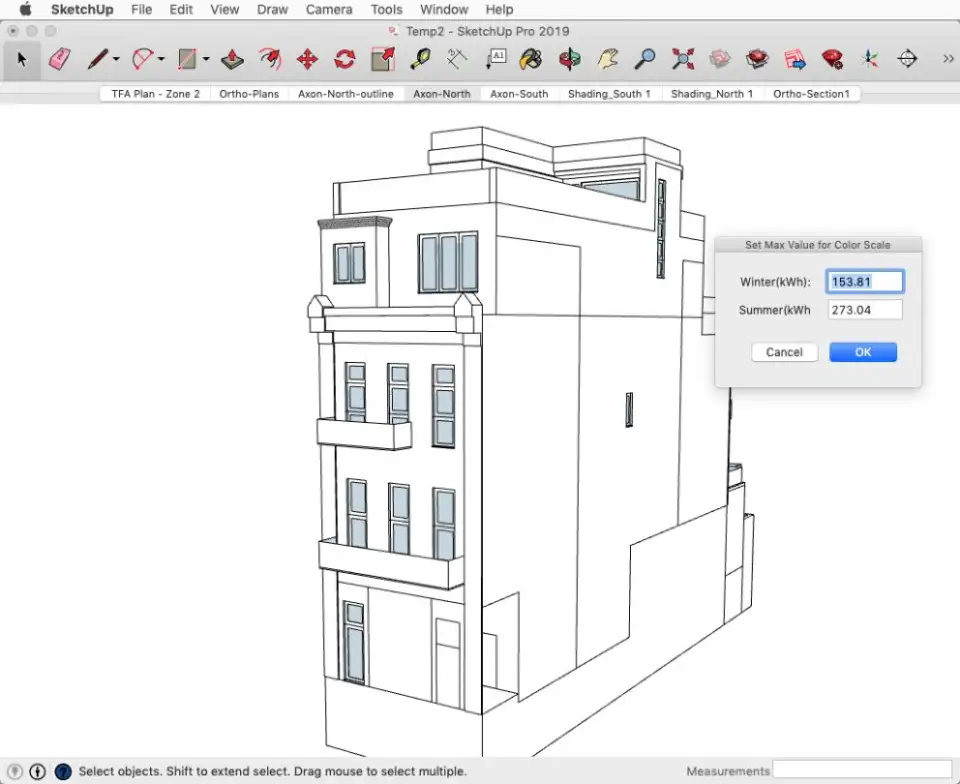
All you need to do next is select ‘dph+ Windows -> Color Windows by Energy Balance’ from the menu, and the desired time-period (winter / summer) as well as the upper and lower limits for the color-gradient.
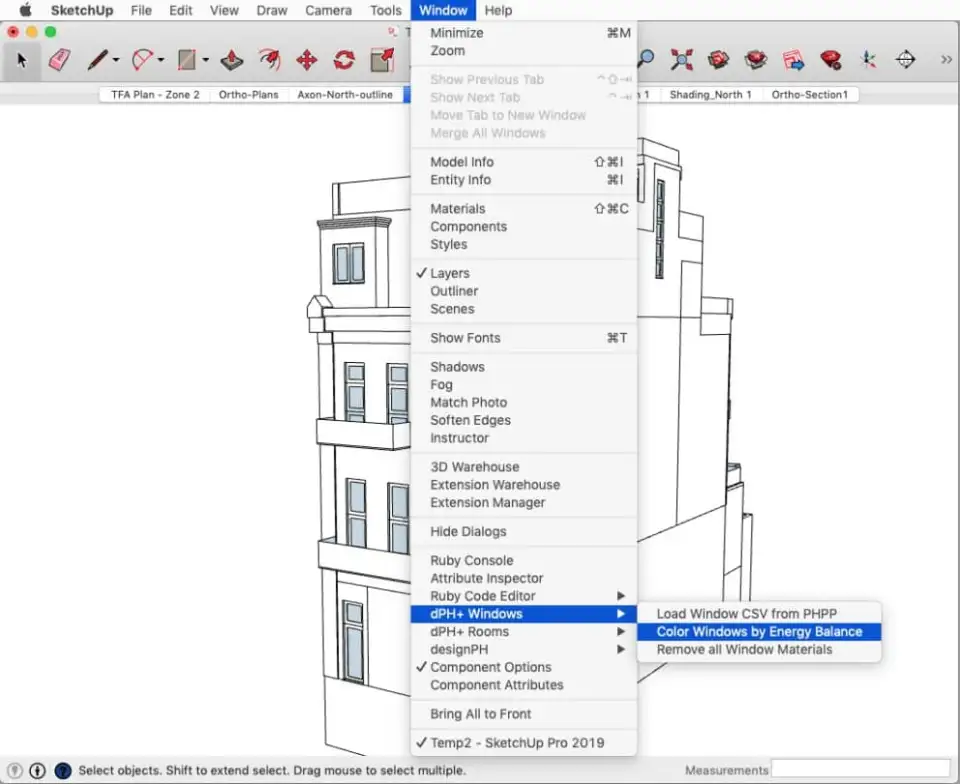
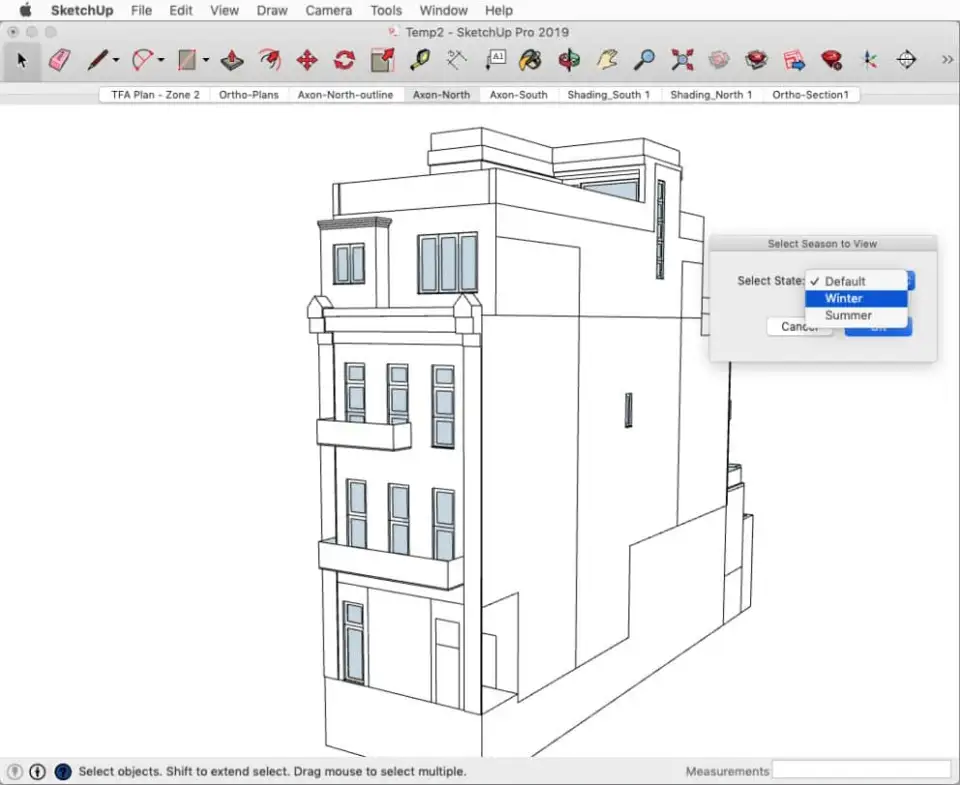
Download: dPH_Windows_v1‑1.zip
Unzip the above file and simply add the unzipped contents (file ‘btdPHPluswindows_Load.rb‘ and folder ‘btdphPluswindows‘) to your Sketchup ‘Plugins’ directory (ie: on mac OS: …/Library/Application Support/Sketchup 2019/Sketchup/Plugins…)
Note that this plugin has been tested and works on Sketchup 2016 — 2019 on Mac OS with DesignPH up to v1.6.02. For earlier versions of Sketchup or newer versions of DesignPH, it may work fine but it has not been tested. (Sketchup Pre-2014 is very unlikely to work) It is strongly recommended to create a copy and backup of your working skp file and test this plugin to be sure it works before ever using it on any actual work/project file. We take no responsibility for any errors or issues that may arise from use of this plugin.