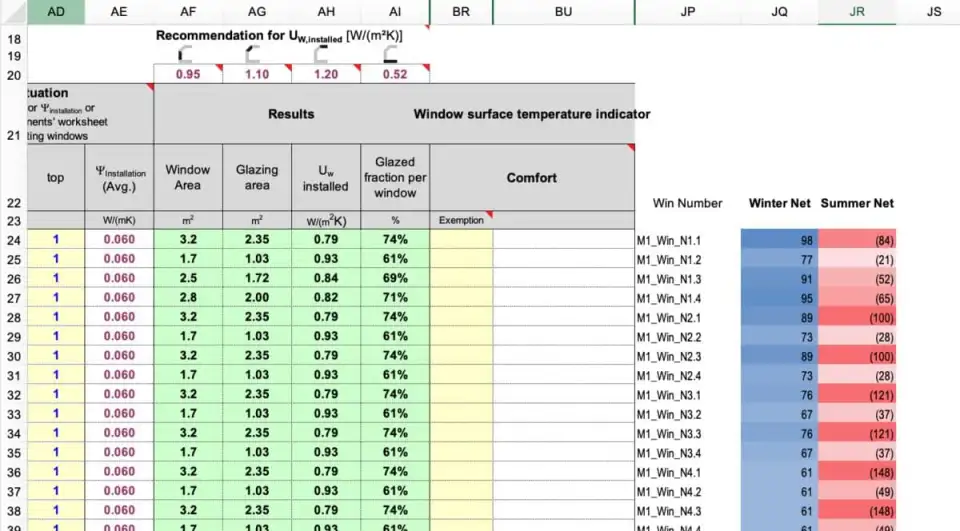
In a previous post here on the Accelerator (link) I showed how window net energy balance data can be linked to a DesignPH Sketchup model for easy visualizations. However, I skipped right over the step of calculating the actual net energy balance data, and so I’d like to go back and revisit that now.
Warning: this is a post all about an excel spreadsheet. If thats not your thing … well … consider this your warning.
Background:
Once windows and shading have been builtin in the PHPP model, a series of calculations are automatically executed using that information which contribute to the overall Heating and Cooling Annual Demand results, the Heating and Cooling Peak Loads, and the overall Primary Energy values.
Understanding how the windows in your project are performing is critical for both overall energy balance results, but also for assessing the risk of overheating. Therefor it can be very useful to review the overall seasonal energy balance for each window individually. PHPP will already give you an approximation of this net-energy balance for the heating season, but for assessing overheating risk and for a more nuanced picture of your building’s performance it can be helpful to see both winter and summer results in more detail. Since PHPP is Excel based it is quite easy to add additional calculators to it using any standard Excel techniques.
Note: For the example shown here, I’ll be working in the ‘SI’ version of the PHPP, but the same process would apply for the ‘IP’ version as well.
Window Net Energy Balance
The calculation we’ll execute here will closely mimic what the PHPP is doing in order to keep our results in line with what we’re seeing in the PHPP elsewhere. This calculation will be familiar to anyone who has gone through the Certified Passive House Designer / Consultant course: We’ll first calculate the total seasonal losses for each window individually, then calculate the total seasonal gains for each window. We’ll find the difference between the losses and the gains, and that will be our net energy balance.
And yes: if you’d like to see even more detailed information, you could certainly do this on a monthly basis if you prefer. For now though we’ll look at an overall seasonal value and we can always increase the level of detail later if we want.
Window Seasonal Heat Loss:
We’ll follow the PHPP’s pattern with regard to variable naming here. The PHPP shows us the total heat loss of any surface (like a window, for example) as:
Q‑T-srfc = A‑srfc U‑srfc f‑t * G‑t
where:
Q‑T-srfc = heat loss of the surface (kWh/winter)
A‑srfc = Area of the Surface (in m2)
U‑srfc = U‑Value of the Surface (W/m2‑K)
f‑t = Temperature Correction Factor (unitless)
G‑t = Seasonal Degree-Hours (k‑K-hrs/winter, like ‘Heating Degree Days’ except its expressed in ‘hours’)
so for each window in the PHPP, we want to harvest those critical four pieces of data (Area, U‑Value, exposure, and climate) and execute our simple heat loss calculation once for winter, then again for summer (the seasons will have a different G‑t value). I’m going to do this all in the ‘Windows’ worksheet, but of course you could also just create a brand new worksheet and do everything there which would maybe be a cleaner way to do it. For now, I’m going to go off to the right hand side of the ‘Windows’ worksheet, and add some new column headings for Heat Loss calculations:
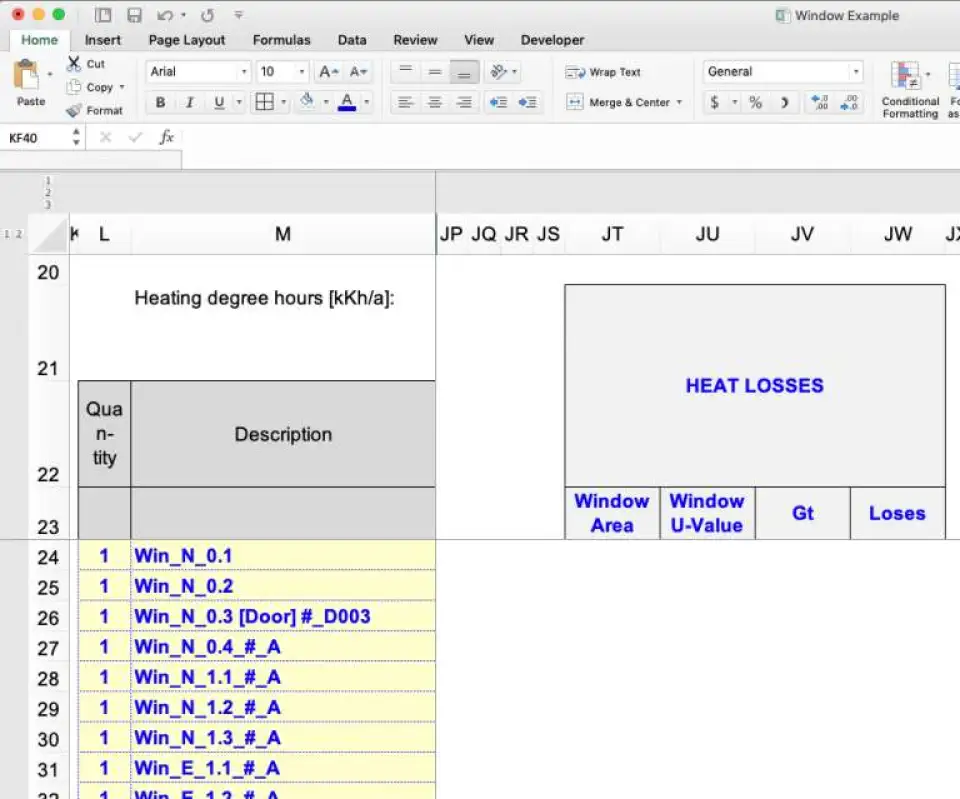
So, now that we have our calculation area set up roughly like the equations show above, we can simply fill in the elements we need for each window in our model (note that I’ll ignore the f‑t here since its always 1.0 for windows which are exposed the normal outdoor ambient conditions). We’ll just harvest the relevant data points from elsewhere in the PHPP ‘Windows’ worksheet for the window’s area, the U‑Value and the G‑t:
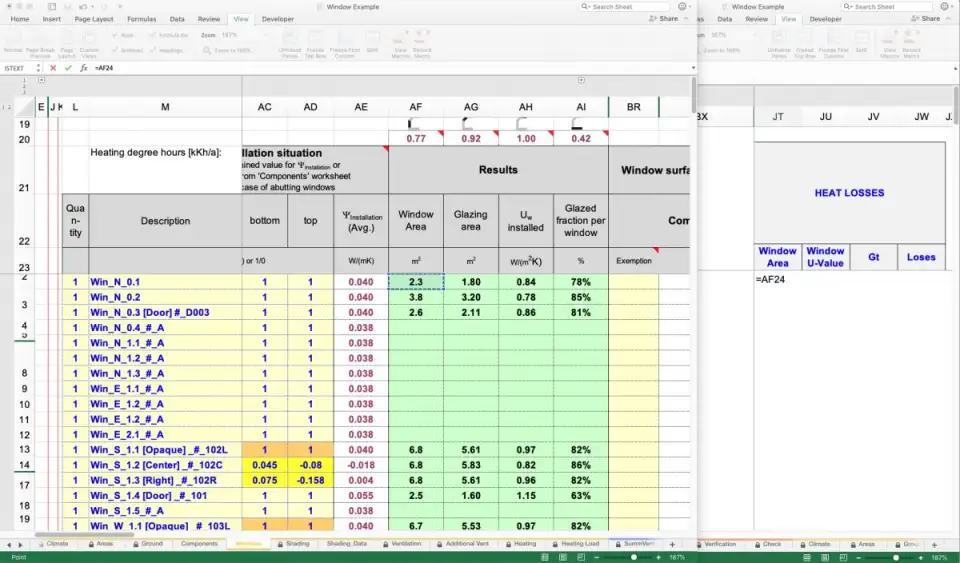
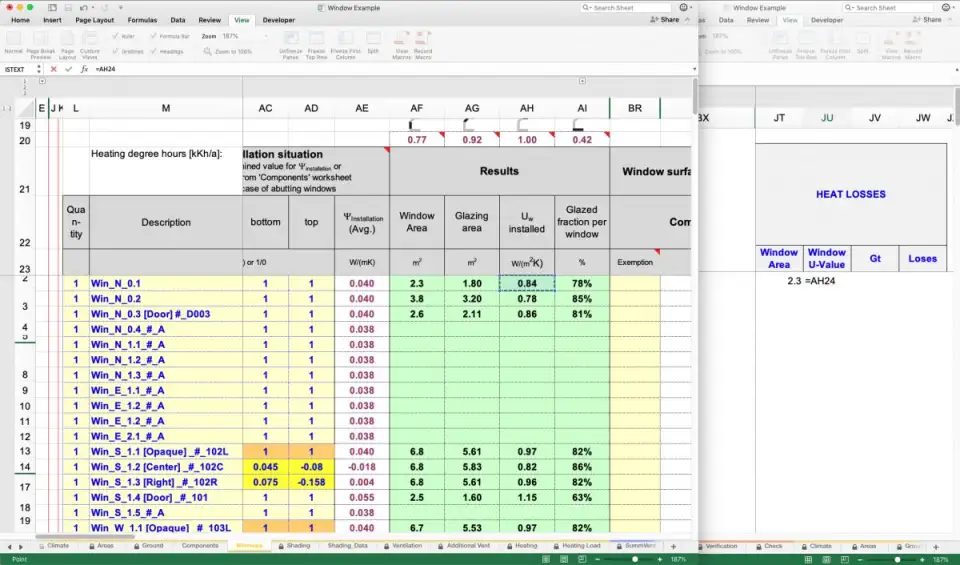
For the G‑t, things are a tiny bit more complicated since the way the PHPP is actually doing all the heat-loss calculations is not really identical to the formula above. So to get the G‑t, we do NOT want to just go grab it from the ‘Climate’ worksheet. If you did this, you’d get a different answer than the PHPP. If you really want to understand what the PHPP is doing behind the scenes, feel free to unhide those orange cells on the ‘Heating’ worksheet and bust out your German-to-English dictionary… but none of that is necessary for our purposes here. The important point is that you want to pull the G‑t from the ‘Heating’ worksheet, NOT the ‘Climate’ worksheet. Thats all we need to know.
(Note, do make sure you make this an ‘Absolute’ reference by adding the ‘$’ before the range’s cell and row in the link, so it should read ‘=Heating!$M$21’ . That way when we copy and paste this formula to the other windows Excel won’t ‘increment’ the link reference)
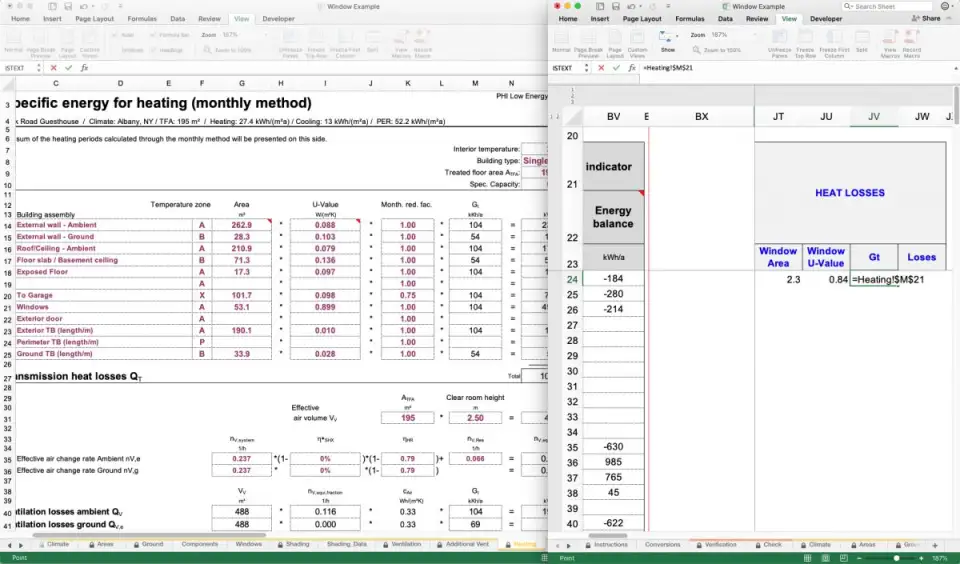
Now that we have all the info for the window, to get the total seasonal losses we can multiply it all together as per the above formula, Q‑T-srfc = A‑srfc * U‑srfc * f‑t * G‑t
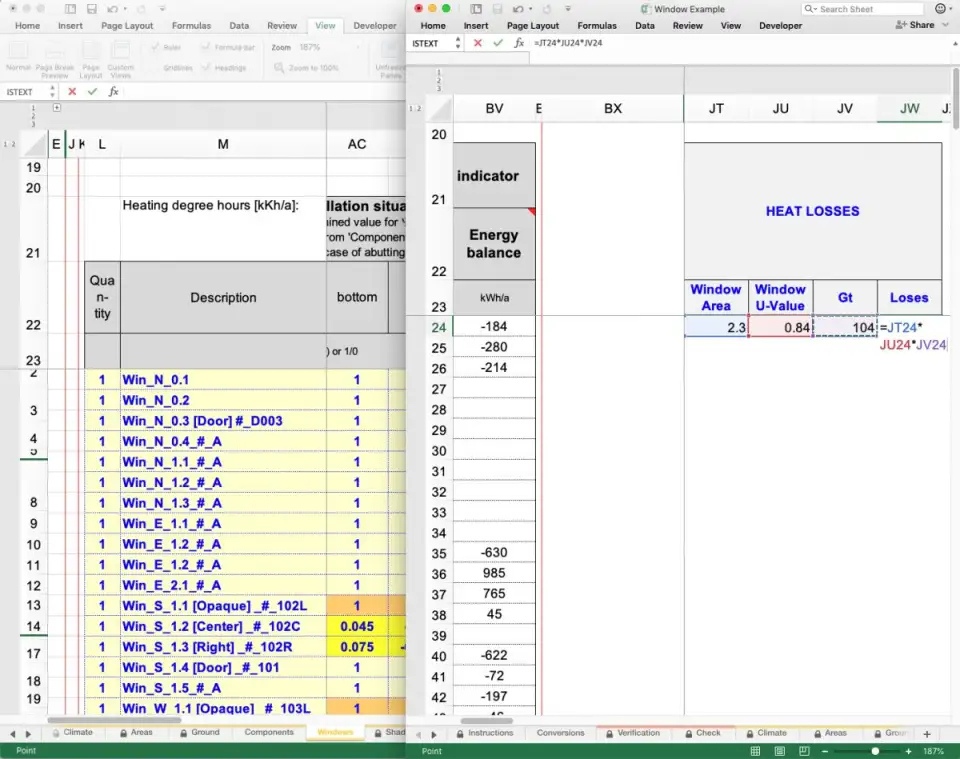
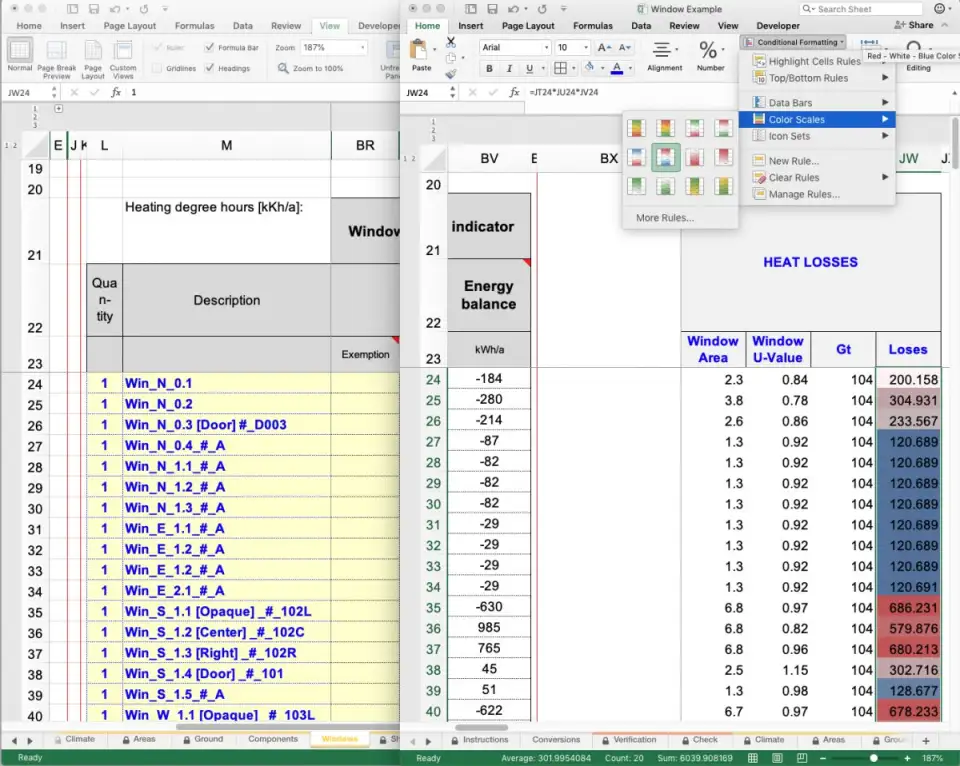
Just copy that same reference / formula set down to each row so that each window gets its own seasonal loss value calculated. If you like, you can use Excel’s built in ‘Conditional Formatting’ to do some quick data visualization on the results. We can quickly see that for the project here, we have a couple really large widows with lots of heat loss (>600 kWh/winter) and then lots of smaller ones with less heat loss (100–200 kWh/winter):
Window Seasonal Heat Loss:
Next up, we need to calculate the total solar gain for each window, after that we can figure out the ‘Net’ by finding the difference between the heat loss and the heat gain. So for solar gain, we’ll again mimic the PHPP structure and variable names here for clarity. We’ll use the formula:
Q‑S-win = A‑glass r SHGC * G
where:
Q‑S-win = total solar gain (kWh/winter)
A‑glass = Area of the glass of the window (m2)
r = Reduction Factors (Unitless)
SHGC = Solar Heat Gain coefficient (Unitless) — also known as the ‘g‑Value’
G = Global Radiation for the window’s orientation (kWh / m2-winter)
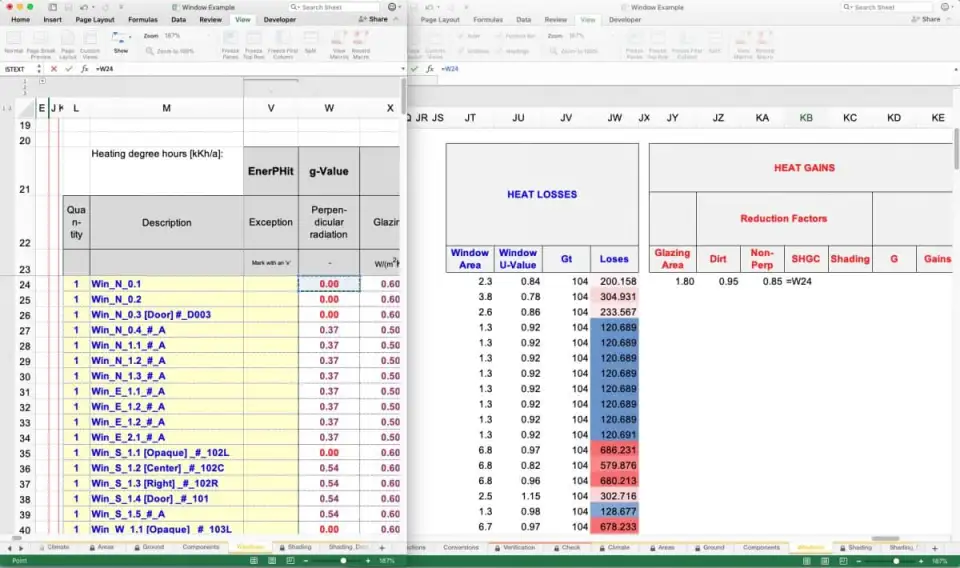
For this calculation, we’ll need to harvest some info from the ‘Windows’ worksheet, some from the ‘Shading’ worksheet, and then some from the ‘Heating’ worksheet. To start, I’ll set up the basic outline in the PHPP ‘Windows’ worksheet off to the right hand side once again, and start linking the cells for one window, starting with the Glass Area:
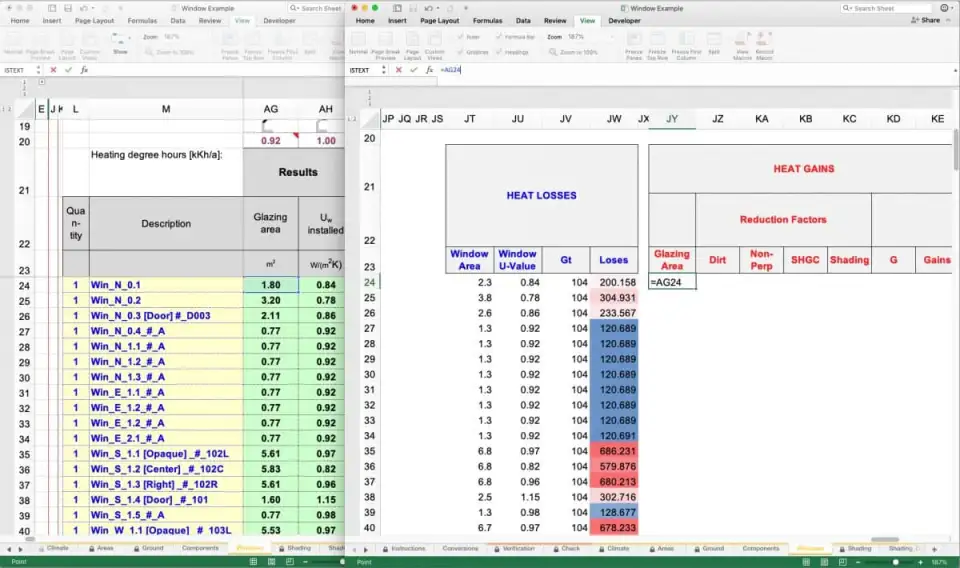
Dirt and Non-Perpendicular Radiation are standard values for winter, so thats easy: 0.95 for Dirt and 0.85 for Non-Perpendicular Radiation reduction factors. For the SHGC (g‑Value), that value can also be linked right from the ‘Windows’ worksheet for each window:
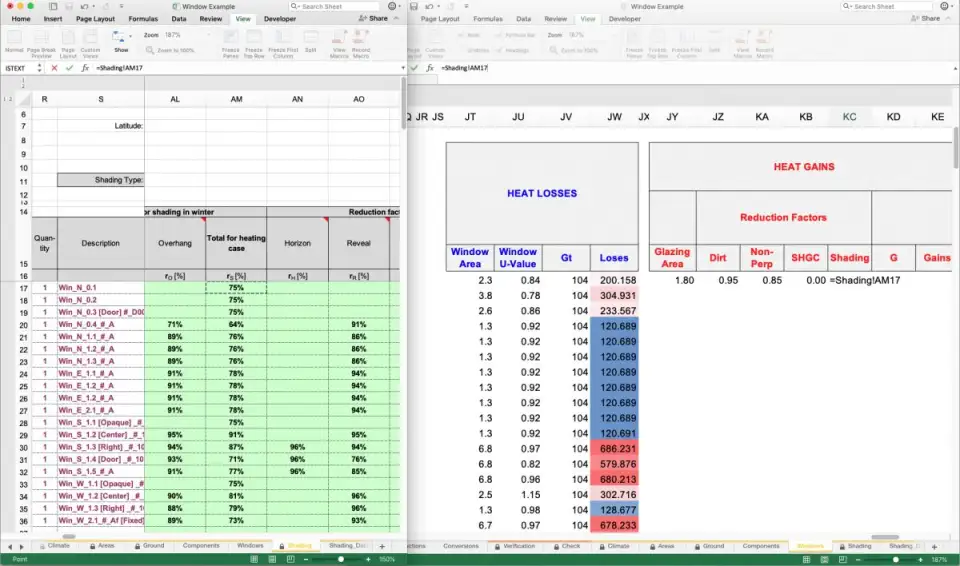
Shading is the next critical data point, and this can be taken right from the ‘Shading’ worksheet. You just need to go over to the right hand side and grab the ‘Total for Heating Case’ reduction factor (make sure its the ‘Winter’ one!) and link that through into your calculation:
The very last item (G value) is the one that takes just a tiny excel function. Nothing fancy. We’ll use the built in VLookup to grab just the right G value for each window from the ‘Heating’ worksheet. To do this, we’ll use this formula in column KD:
=VLOOKUP(P______,Heating!$C$54:$M$58,11,FALSE)
with P_____ including the row number. So for our first row, we’ll do that as:
=VLOOKUP(P24,Heating!$C$54:$M$58,11,FALSE)


That formula will look at the window’s orientation (inherited from the host surface’s orientation), then compare it to the table in the ‘Heating’ worksheet and pull out the right G value for the window’s orientation (North, South, East, West or Horizontal).
At this point, we just multiply everything together to get the final kWh/winter of total heat gain from the sun.

And lastly we find the window’s seasonal net energy (kWh/winter) by taking the Heat Losses minus the Heat Gains:
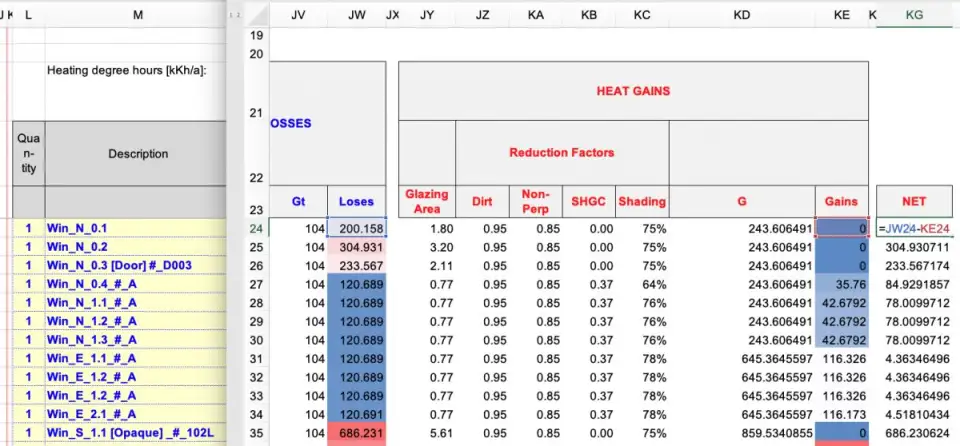
Once that is all completed, you can do it all again for the summer season in another set of columns to the right hand side (yup, it gets to be kind of a big excel sheet) and perhaps even fold in the seasonal Utilization Factor if you’re feeling ambitious. Just be sure to grab the right G‑t (this time from the ‘Cooling’ worksheet) and the right G (again, for summer this comes from the ‘Cooling’ worksheet instead of the ‘Heating’ worksheet). You can now see detailed winter and summer net energy values for each window being calculated in real time as you adjust shading, window U‑Values, frame types or any other parameter you like.
Certainly you wouldn’t want to do this setup each time you start a new project. In our office we have an ‘office’ PHPP that we’ve added several of these supplemental calculators too, as well as some default values and components. We use this ‘modified’ PHPP each time we start a new project, so this is already built in. Of course we also have a ‘pristine’ copy of the PHPP saved away for actual Certification use. But for design stage work and connecting to the 3D model for visualization, this is the technique we’ve been using.
One last note — I like this technique a LOT for catching errors. Simply applying the excel ‘Conditional Formatting’ can really help you spot windows which have errors in them someplace. For example: if you have 4 identical windows on the same side of the building, and three show up ‘blue’ (net loss) but one shows up ‘red’ (net gain) you know you have something screwy going on someplace and you should dig into the components, shading or other inputs to find what is driving that error. You can also, as I described elsewhere, link this data up to your 3D model for easy visualizations which are an even better way to catch errors and understand just how your window design is influencing your building’s performance.
I hope that explanation is helpful and of course if you have any questions (or maybe you have found a better method for this sort of thing?) feel free to email me: [email protected]